Scenario Generation
To simulate realistic and varied network environments, a smart allocation strategy is used when generating graph-based scenarios. This strategy assigns services and vulnerabilities to nodes while embedding configurable cyber-terrain features. These scenarios are generated based on the environment database (generated using a specific Shodan query) defined in the root-level config.yaml.
Configuration Parameters
Before generating scenarios, customize the parameter ranges used for domain randomization in the following file cyberbattle/env_generation/config/generation_config.yaml.
Each scenario is generated by sampling values from the specified ranges to create diversity among scenarios exposed to the agent during training and evaluation, and hence encourage generalization. Below is an example:
num_nodes_range: [10, 100]
num_services_range: [1, 3]
firewall_rule_incoming_probability_range: [0, 0.33]
firewall_rule_outgoing_probability_range: [0, 0.33]
knows_neighbor_probability_range: [0.2, 0.8]
data_presence_probability_range: [0.2, 0.8]
partial_visibility_probability_range: [0.2, 0.8]
need_to_escalate_probability_range: [0.2, 0.8]
service_shutdown_probability_range: [0, 0.2]
success_rate_probability_range: [0.6, 1]
...
Cyber-terrain features model obstacles and challenges to the agent:
Firewall rules: Control port-based access (incoming/outgoing).
Partial visibility: Limits visibility to a node feature vector that can be unlocked with a Discovery vulnerability action.
Privilege escalation requirements: Forces multi-step exploitation, simulating a probabilistic range of ROOT privileges need on each node.
Exploit success rates: Introduces a probabilistic risk of failure when exploiting vulnerabilities.
Service shutdown: Models inactive or down services making their vulnerabilities inaccessible.
Additional valuable elements are modeled:
Data presence and value: Simulates a certain importance value for node and the presence of data.
Neighbor discovery: Models the probability of discovering other neighbor nodes probabilistically when launching a Reconnaissance vulnerability action.
These features are also used to compute a scenario complexity metric used to categorize how complex scenarios are.
Generation Command
To generate scenarios, run the following from the scenario generation module:
cd cyberbattle/env_generation

python generate_graphs.py \
    --name ENVS_FOLDER_NAME \
    --num_graphs NUM_SCENARIOS \
    --percentage_type {iot, routers, windows, unix, ics, mixed_equally, random} \
    --split_train TRAINING_SET_PERCENTAGE \
    --split_val VALIDATION_SET_PERCENTAGE \
    --nlp_extractors NLP_EXTRACTORS
This command generates a folder under cyberbattle/data/env_samples/ENVS_FOLDER_NAME, containing graph scenarios and configuration logs.
--percentage_type: Defines how node types (e.g., IoT, Windows) are assigned to nodes.e.g.,
iotassigns all nodes as IoT.mixed_equallyassigns equal proportions of each type.randomsamples types randomly.
--split_trainand--split_val: Define training and validation set sizes. The test set is implicitly derived. Splitting is achieved using the complexity metric (most complex in the test set, less complex in the validation set, and least complex in the training set).--nlp_extractors: One or more NLP extractors to embed services and vulnerabilities in the feature vectors.
Service Allocation Logic
The script generate_graphs.py uses a weighted sampling mechanism to assign services realistically. Each service is selected based on:
Validity constraints: Ensures compatibility with host OS (e.g., only Windows-compatible services like Microsoft Outlook on Windows hosts).
Real-world trends: Services are sampled based on a weight \(w_i = f(\mathit{device\ count}_i)\). By default, the weighting function is \(f(\cdot) = 1 + \log(\mathit{device\ count}_i)\). The sampling function encourages services with higher device counts (i.e., more common in the environment database) to appear more frequently in the generated scenarios, thereby aligning them with real-world distributions.
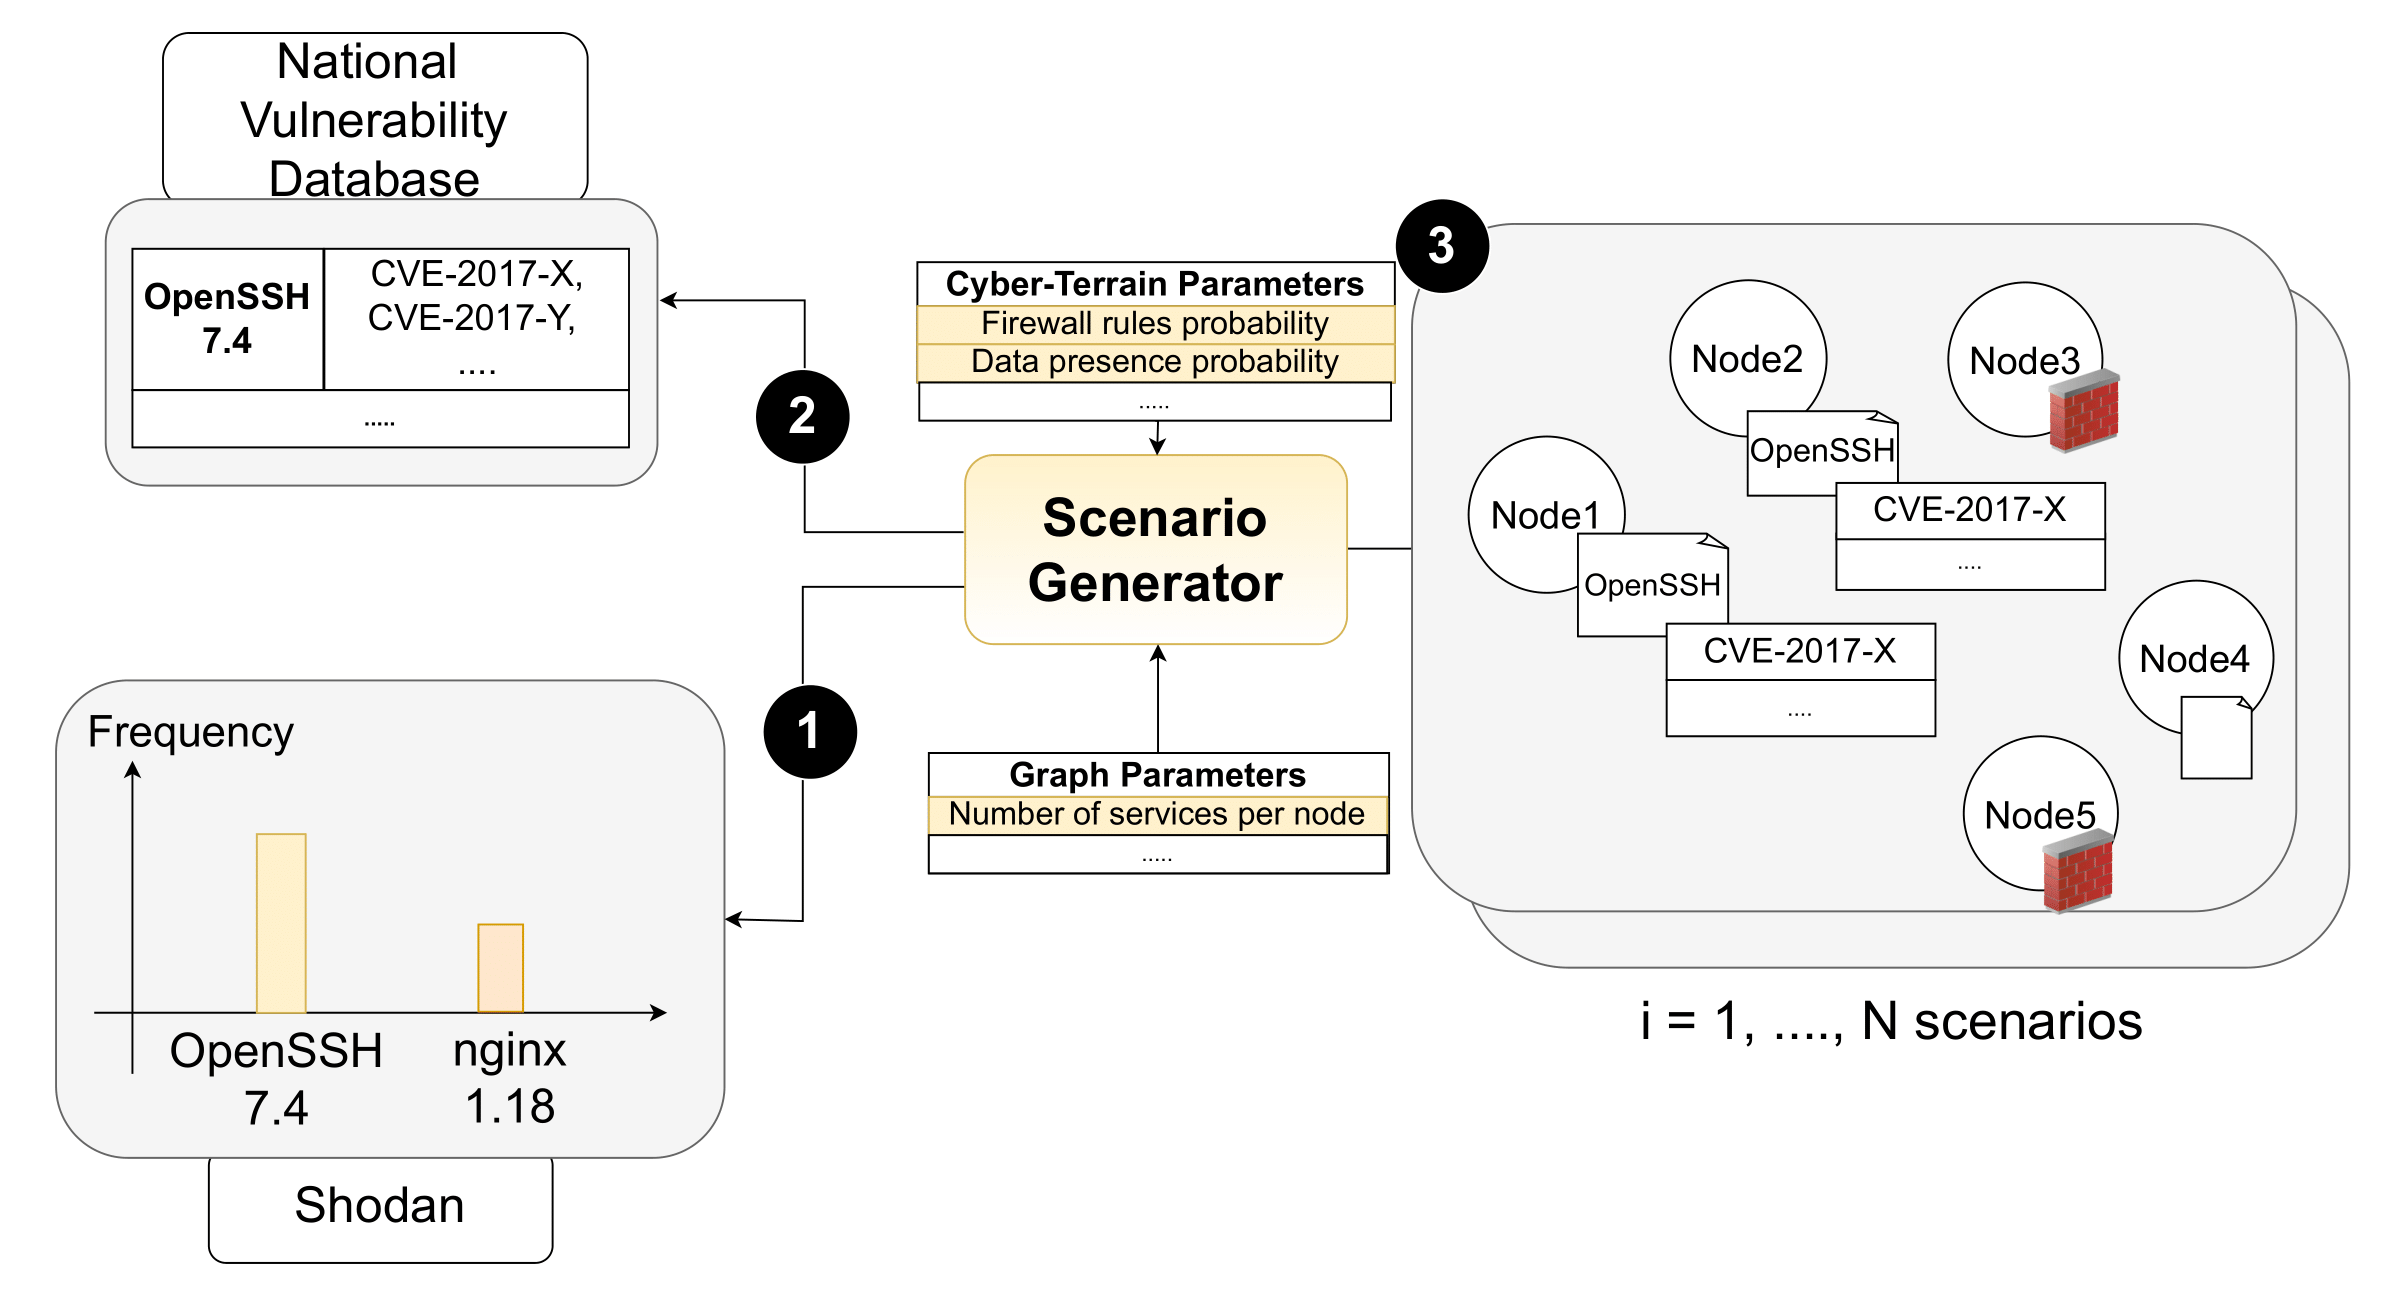
Figure 2 – Overview of the scenario generation process: (1) use Shodan frequencies to sample the service version to allocate, (2) retrieve its vulnerabilities from the NVD, and (3) embed the service and vulnerabilities into a node.
Generated Folder Structure
Each scenario is stored in a numbered folder in the logs folder with the following structure:
LOGS_FOLDER
├── 1
│   ├── network_bert.pkl
│   ├── network_CySecBERT.pkl
│   └── vulnerabilities_distribution.yaml
├── 2
│   ├── ...
├── ...
├── app.log
├── generation_config.yaml
├── graphs_stats.csv
└── split.yaml
network_*.pkl: Graph with NLP embeddings per extractor.
vulnerabilities_distribution.yaml: Vulnerability distribution per scenario.
graphs_stats.csv: Scenario features used to compute complexity scores.
split.yaml: Train/val/test splits based on scenario complexity.
generation_config.yaml: Snapshot of generation configuration.
Default Scenario Set
A default set of scenarios is downloaded during the initial setup (init.sh or setup.py) and used unless otherwise specified. To switch to your own generated scenarios, update the path in the root config.yaml:
default_environments_path: your_env_folder_name
Scenario Complexity Metric
Scenario complexity is computed using criteria defined in: config/complexity_criteria.yaml.
Each characteristic is marked as maximize or minimize depending on how it impacts complexity. For example:
num_nodes: maximize
num_unique_combinations: maximize
firewall_rule_incoming_probability: maximize
firewall_rule_outgoing_probability: maximize
knows_neighbor_probability: minimize
...
Modify this file to customize complexity evaluation for your scenarios.